1Social Research Methods, SOWK 4040
Statistics Lab #1 – Descriptive Statistics (Frequency Distributions, Bar Graphs, and
Crosstabs) using Google Sheets
Assignment Instructions
Frequencies and Bar Charts
Watch the video on Moodle called “Frequency Tables and Bar Charts in G Sheets” and
then complete the following steps.
A. Open a Google window. Select Google Sheets from the nine-dot menu at the top
right part of the page. Click on Start a new spreadsheet (blank).
B. Name your file. Click on Untitled spreadsheet at the top left of your screen and
name your file. The file saves automatically so you won’t lose information when
you close the window.
C. Copy the data into the Google spreadsheet window. Copy and paste the data
table on page 3 of this document to your spreadsheet. This will create your
dataset.
D. Run Frequency Tables and Bar Charts for the variables Gender, Veteran
Status, Group Assignment, and Satisfaction with Treatment, as show in the
video. Do not do this step for the Subject or Age variable.
Next, answer the following questions.
1. What percentage of the sample are Female veterans?
2. How many subjects in the sample are in the Discharged category?
3. What percentage of the subjects have the COD group assignment?
4. What percentage of the subjects in this sample is Very Satisfied with their
treatment services?
Descriptive Statistics
Now watch the second video on “Descriptive Statistics in G Sheets” on Moodle and run
the descriptive statistics (mean, median, and mode) for the Age variable.
Answer the following questions.
5. What is the mean Age of this sample?
6. What is the mode for the Age variable?
Crosstabulation
Watch the video called “Crosstabulation in G Sheets” in Moodle. Run a
Crosstabulation (pivot table) using Veteran Status as the independent variable (column
variable) and Satisfaction with Treatment as the dependent variable (row variable).
2
Next, answer the following questions.
7. What percentage of the Active veterans are Neither Dissatisfied nor Satisfied
with their treatment?
8. How many veterans does the percentage in question 7 represent?
9. Comparing those who were Very Dissatisfied with those who were Very
Satisfied, among the Discharged veterans, is there a significant difference in the
two percentages? (Use the 10% difference rule).
10. Referring to question 9 above, what is the actual difference between the two
percentages?
NOTE: The answers to the questions above should be word processed and uploaded
in a separate document. Make sure the numbers of your answer correspond to the
number of the question on this instruction sheet. You need to turn in:
1. The answers to the questions above in a separate Word or Google
document and in APA Format. Upload that Word or Google document
to the assignment Moodle site.
2. Your Google Sheets output file showing all statistical tables and charts.
In Sheets, click on File>Download>PDF Document and upload the PDF
to the assignment Moodle site.
3
Data Set
The following is a data set created for this exercise. SUBJECT is the respondent’s
survey number (DO NOT treat this column as a variable). GENDER and AGE are selfexplanatory. VETERAN STATUS is the client’s status in the military at time of
treatment. GROUP ASSIGNMENT is the specific treatment group they attended while
in the program. SATISFACTION WITH TREATMENT is the subject’s satisfaction
with the services they received in the program. Please enter the following data into a
blank Excel spreadsheet, as demonstrated in the class videos, and save to your network or
other drive.
SUBJECT
GENDER
01
02
03
04
05
06
07
08
09
10
11
12
13
14
15
16
17
18
19
20
M
M
M
M
F
M
M
M
M
M
F
M
M
M
M
M
M
M
F
M
AGE
VETERAN
STATUS
GROUP
ASSIGNMENT
36
30
24
22
45
39
44
24
22
27
29
33
31
40
28
47
26
47
23
34
Active
Discharged
Active
Discharged
Discharged
Active
Active
Active
Active
Active
Active
Active
Discharged
Discharged
Active
Active
Active
Active
Active
Active
COD
Mental Health
COD
Mental Health
Mental Health
Mental Health
COD
COD
Mental Health
Mental Health
COD
Mental Health
COD
COD
COD
Mental Health
COD
Mental Health
Mental Health
Mental Health
SATISFACTION
WITH
TREATMENT
Very Satisfied
Satisfied
Dissatisfied
Neither D or S
Very Satisfied
Very Satisfied
Satisfied
Neither D or S
Very Dissatisfied
Very Satisfied
Dissatisfied
Very Satisfied
Very Satisfied
Satisfied
Satisfied
Dissatisfied
Very Satisfied
Satisfied
Very Satisfied
Essay Writing Service Features
Our Experience
No matter how complex your assignment is, we can find the right professional for your specific task. Achiever Papers is an essay writing company that hires only the smartest minds to help you with your projects. Our expertise allows us to provide students with high-quality academic writing, editing & proofreading services.
Free Features
Free revision policy
$10Free bibliography & reference
$8Free title page
$8Free formatting
$8How Our Dissertation Writing Service Works
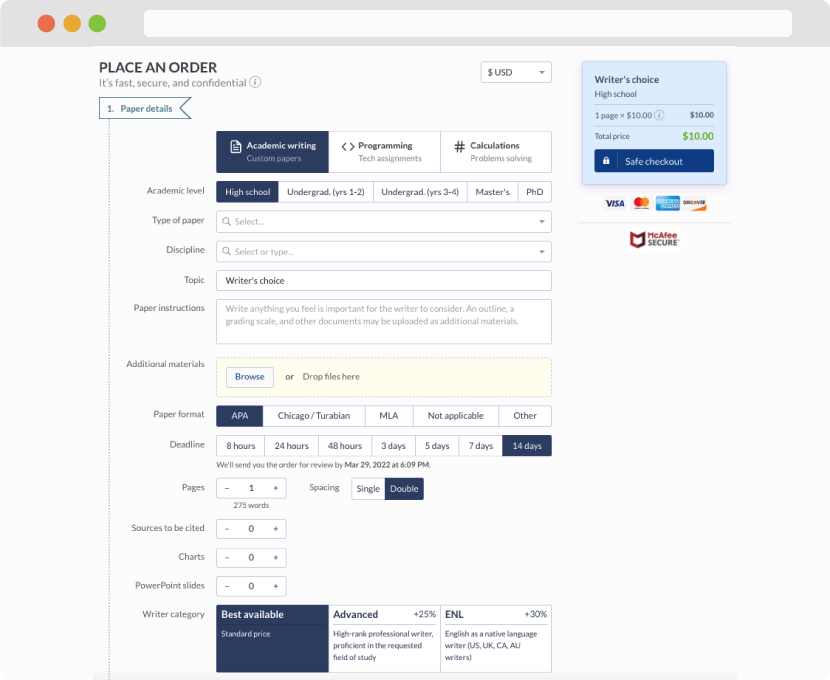
First, you will need to complete an order form. It's not difficult but, if anything is unclear, you may always chat with us so that we can guide you through it. On the order form, you will need to include some basic information concerning your order: subject, topic, number of pages, etc. We also encourage our clients to upload any relevant information or sources that will help.
Complete the order form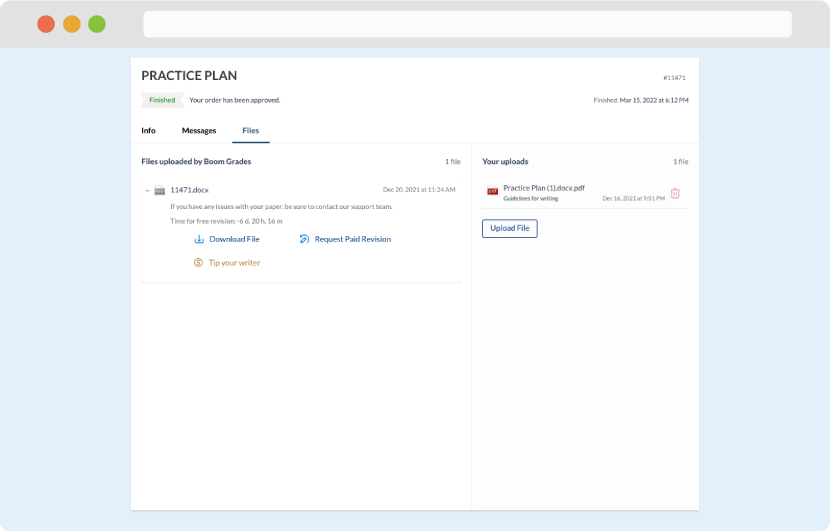
Once we have all the information and instructions that we need, we select the most suitable writer for your assignment. While everything seems to be clear, the writer, who has complete knowledge of the subject, may need clarification from you. It is at that point that you would receive a call or email from us.
Writer’s assignment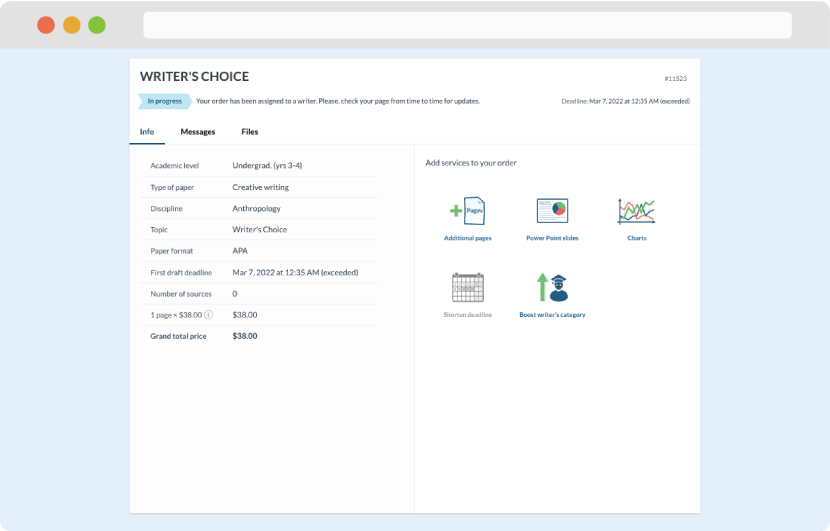
As soon as the writer has finished, it will be delivered both to the website and to your email address so that you will not miss it. If your deadline is close at hand, we will place a call to you to make sure that you receive the paper on time.
Completing the order and download